Stop Guessing: See Through Whale Intentions with Hyperbot's New Trend Charts
Stop guessing whale sentiment. Hyperbot's updated Whale Analysis now features historical Trend Charts for "Long/Short Ratio" vs. "Position Value Difference." Spot divergences between headcount and real capital flow instantly. Catch the smart money moves before they happen.

Visualizing Sentiment: Why Snapshots Lie and Trends Reveal the Truth
In crypto trading, we are all trying to answer the same question: "What is the Smart Money doing right now?"
In the past, if you looked at any data dashboard, you might see an isolated number: "Whale Long/Short Ratio: 50.29%." Sounds balanced, right? But that number alone is dangerous. It's a static snapshot. It doesn't tell you if that ratio is rising or falling. More importantly, it doesn't tell you where the real money is actually flowing.
To eliminate this "data blind spot," Hyperbot has officially upgraded the Whale Analysis dashboard. We no longer just give you a number; we give you a powerful visual trend chart, allowing you to read whale sentiment flow just like you read a price chart.
Why "Snapshots" Can Be Deceptive
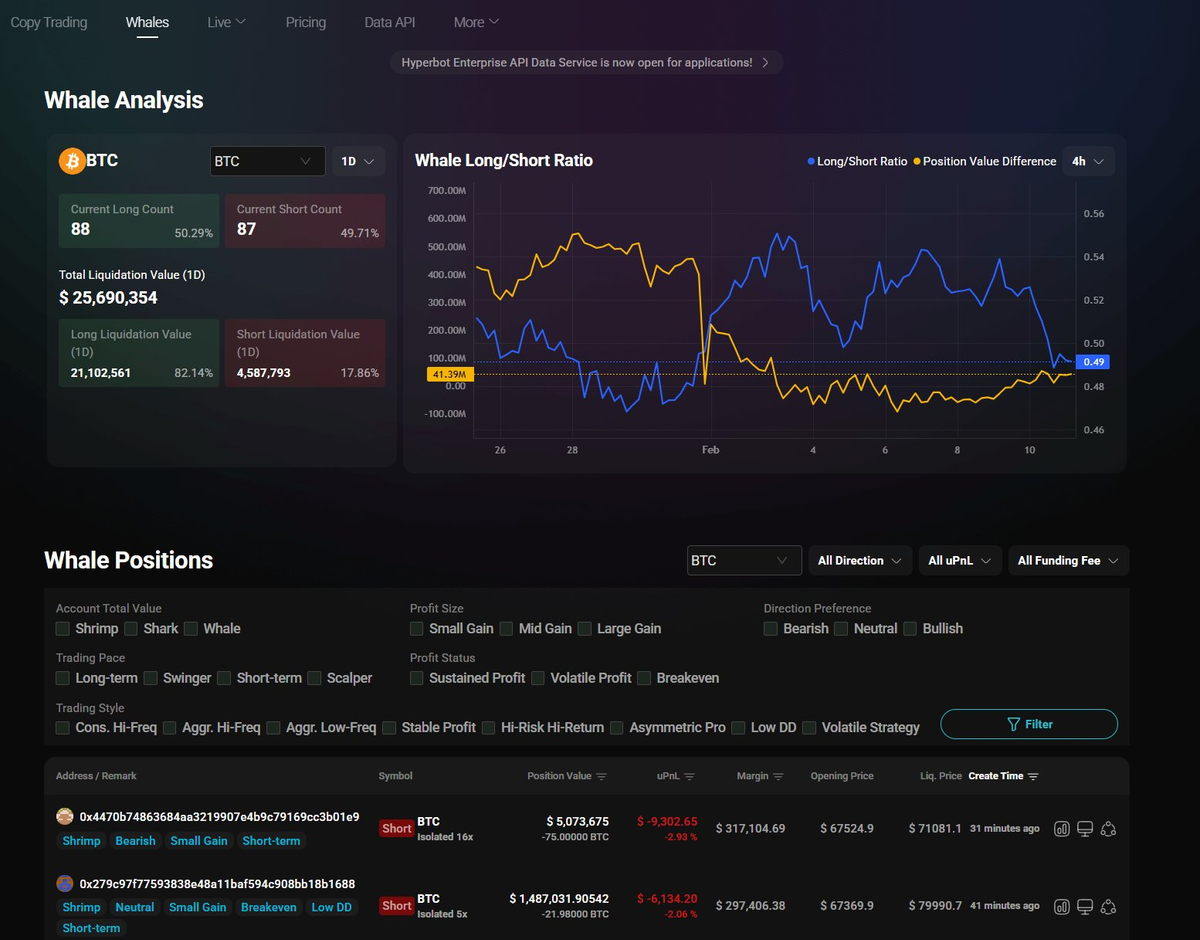
Let's take a look at the real data from the Hyperbot dashboard (referencing the screenshot above):
- Current Long Count: 88 (50.29%)
- Current Short Count: 87 (49.71%)
If you only look at this column, you would think the market is in a perfect stalemate, or a "chop" zone.
But look at the "Liquidation Value" in the bottom left:
- Long Liquidation Value (1D): $21,102,561 (82.14%)
- Short Liquidation Value (1D): $4,587,793 (17.86%)
Here lies a massive asymmetric risk. While the headcount of longs and shorts is nearly identical, the liquidation risk for longs is 4x higher than for shorts. This means current longs are either over-leveraged or entered at poor positions. This is the critical detail that static data often misses.
The New Feature: Tracking "Sentiment" vs. "Value"
Hyperbot's new trend chart on the right introduces historical tracking for two core dimensions. This is where the Alpha lives:
1. 🔵 Whale Long/Short Ratio
The Blue Line represents the "Battle of Headcount." It tells you the sentiment of whale accounts by number. When the blue line rises sharply, it means more individual whale accounts are flipping bullish.
2. 🟡 Position Value Difference
The Yellow Line represents the "Battle of Capital." This is the most critical indicator. It calculates the net difference: (Total Long Position Value - Total Short Position Value).
Why do you need both lines? Look closely at the chart in the screenshot. You will notice that the Blue Line (Headcount) and Yellow Line (Money) are not always synchronized.
- Divergence is the Signal: Imagine if the Blue Line (Headcount) is rising, but the Yellow Line (Money) is crashing. What does that mean? It means that while many "smaller whales" are buying, a few "mega whales" are shorting with massive capital, dragging the net value down.
In trading, following the money (Yellow Line) is often more accurate than following the crowd (Blue Line).
Practical Analysis: What is the Chart Telling Us?
Returning to the latest trend in the screenshot:
- Jan 26 - Jan 28: The Yellow Line (Money) and Blue Line (Ratio) moved in sync.
- Jan 29 - Feb 1: The Yellow Line (Value Difference) fell off a cliff, even breaking below the zero axis. This indicates that during that period, smart money was aggressively distributing or building short positions.
- Current (Now): While the Blue Line has rebounded to around 0.49 (near balanced), the Yellow Line is still hovering at the lows.
Conclusion: Although the number of whales participating in longs is recovering, the net capital flow remains weak. Combined with the precarious $21M long liquidation risk on the left, the current market structure is extremely fragile. Without a significant influx of real capital (Yellow Line), a simple rebound in headcount might just be a bull trap.
Summary: Let the Data Speak
In a market dominated by PvP dynamics, information asymmetry is profit. Hyperbot's latest update aims to eliminate that gap.
Stop guessing if whales are accumulating or distributing. By observing the divergence and convergence between the Long/Short Ratio and Position Value Difference, you can pinpoint the exact moment smart money shifts direction.
Stop guessing. Start tracking.
👉 Experience the new Whale Analysis Dashboard now:https://hyperbot.network/whales
Join Hyperbot to trade smarter:
🔹 Follow us on X: https://x.com/Hyperbotai
🔹 Visit our website: https://hyperbot.network/
🔹 Whitepaper: https://hyperbot.gitbook.io/hyperbots-organization
🔹 Telegram Channel: https://t.me/Hyperbotofficial
🔹 Join Discord: https://discord.com/invite/5AMtqkzpFs
🔹Telegram Tracker Bot :https://t.me/hyperbottracker_bot
🔹Telegram Trading Bot:https://t.me/Hyperbotai_bot
Disclaimer: This report is for informational purposes only and does not constitute financial advice. On-chain data is highly dynamic; high-leverage trading carries extreme liquidation risks.