Goodbye "Manual Warfare": How Hyperbot is Rewriting On-Chain Trading with Visualization & APIs
Hyperbot's updated Whale Analysis now features historical Trend Charts for "Long/Short Ratio" vs. "Position Value Difference." Spot divergences between headcount and real capital flow instantly. Catch the smart money moves before they happen.

From Guesswork to Gunpowder: How Hyperbot is Arming Traders in the PvP Era
The crypto market of February 2026 is undergoing a brutal baptism of "chop." Bitcoin is sprinting back and forth between $90k and $100k, painting "Bart Simpson" patterns on the chart that are designed to liquidate both longs and shorts.
In a recent community AMA, Hyperbot host Tracy pinpointed the harsh reality of the current market:
"The market is doing cardio, while whales are raving on-chain. This is a god-tier PvP game. Retail traders without tools are destined to become the 'fuel' for this game."
But this doesn't mean retail traders are helpless. If you have "night vision" to see the whales' cards, or an "automatic rifle" to pull the trigger 0.1 seconds faster than the crowd, the tide of battle changes.
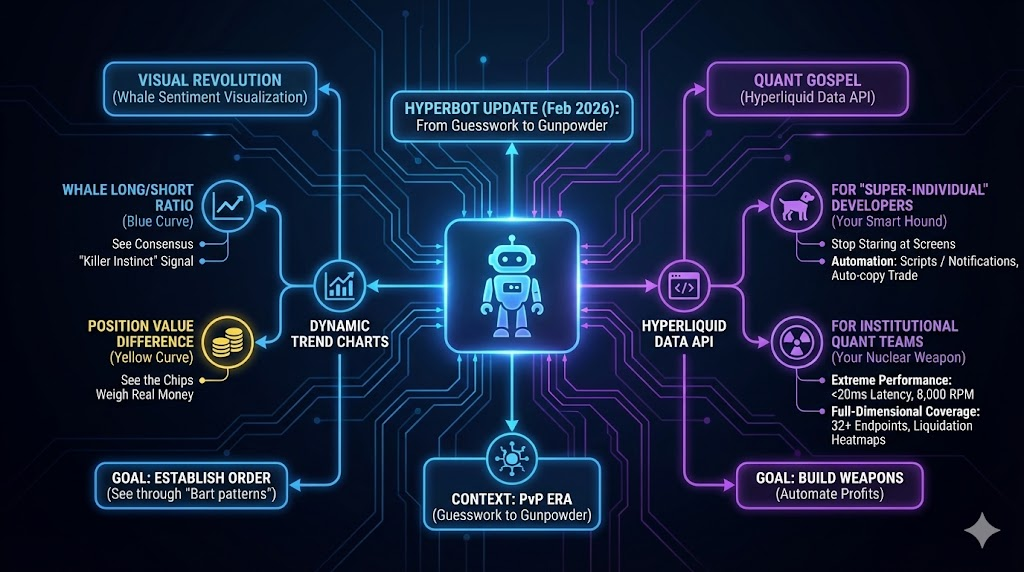
This week, Hyperbot officially launched two nuclear weapons: Whale Sentiment Visualization and the Hyperliquid Data API. This isn't just a feature update; it's a generational leap in how we trade.
1. Visual Revolution: Don't Just Look at Numbers, Look for the "Killer Instinct"
In the past, Hyperbot's "Whale Analysis" page was a wall of dense position data. While accurate, it was too static for a market that changes in milliseconds.
As Tracy noted in the AMA: “Don’t just look at the current ratio; look at the slope!”
To solve this, Hyperbot has launched the all-new [Dynamic Trend Charts], allowing traders to intuitively capture the "emotional fluctuations" of on-chain capital:
- 🔵 Whale Long/Short Ratio — Seeing Consensus: When the market is crabbing sideways, if this blue curve suddenly shoots up at a 45-degree angle, it’s not just a number changing—it’s a signal that whales have reached a "Long Consensus." This is the hidden "killer instinct" in the market, the Alpha that a manual calculator can never tell you.
- 🟡 Position Value Difference — Seeing the Chips: This metric is even more hardcore. It doesn't just count heads; it weighs the real money on the scale. When the yellow curve deviates significantly from the zero axis, it often means one side is exhausted, and a reversal is imminent.
Your New Strategy: Stop guessing. Open the "Whales Page" on the Hyperbot dashboard and look at the curve. Is it a bull trap or a real pump? The trend chart gives you the answer.
2. The Quant Gospel: A "Nuclear Engine" for Code
If visualization is for human eyes, then the Hyperliquid Data API is for machine code.
Trading in 2026 is evolving from "manual clicking" to "algorithmic warfare." To arm the technical flow within our community, Hyperbot has opened this top-tier data engine—based on Hyperliquid—to two core user groups:
🐕 For "Super-Individual" Developers: Your Smart Hound
For individual traders who know a bit of Python or JavaScript, this API is the key to liberating your hands.
- Stop Staring at Screens: Access the Smart Money Leaderboard and Trader Profiles via API.
- Automation: Write a simple script to monitor the top 10 whales by win rate. Once they open a position, the program automatically pushes a notification to your phone or even auto-copies the trade. Turn complex on-chain analysis into your private "money printer."
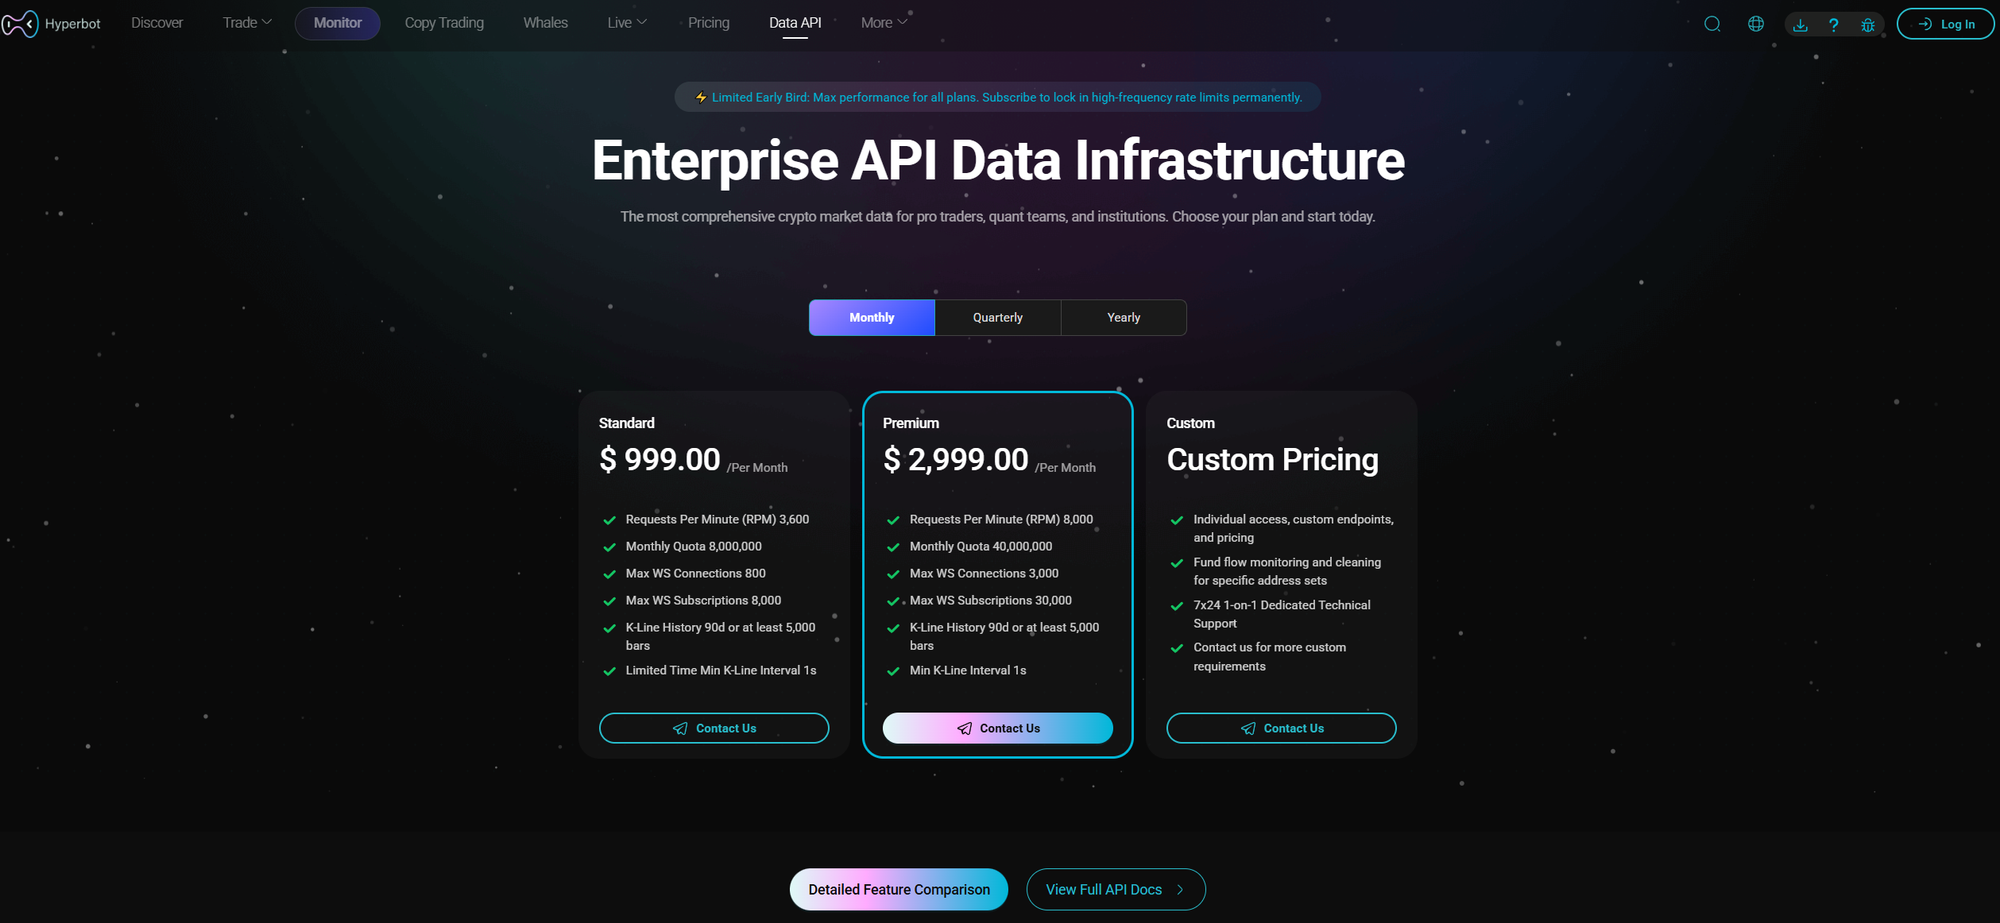
☢️ For Institutional Quant Teams: Your Nuclear Weapon
For quant teams and HFT studios demanding extreme speed, Hyperbot provides infrastructure-level support.
- Extreme Performance: Direct connection to Hyperliquid validator nodes, offering <20ms latency and 8,000 RPM high-frequency throughput.
- Full-Dimensional Coverage: Open access to 32+ core data endpoints, including millisecond-level Order Streams and market-wide Liquidation Heatmaps.
- Value: This is a one-stop data infrastructure that helps you achieve a dimensional strike in the millisecond-level arbitrage competition.
3. Conclusion: Building Order in Chaos
The more chaotic the market, the more it tests your tools.
Today's update sends a clear signal: Hyperbot is not just an aggregator; it is an enabling platform.
- For Manual Traders: We use visual charts to help you establish Order, seeing through the "Bart patterns" of whales.
- For Developers: We use API interfaces to help you build Weapons, automating profits on the on-chain battlefield.
In this era of "Clash of Gods," don't be the unarmed bystander.
👉 Experience the New Features Now:
- Whale Analysis Dashboard:Hyperbot.network/whales
- API Documentation:Hyperbot API Docs
Join Hyperbot to trade smarter:
🔹 Follow us on X: https://x.com/Hyperbotai
🔹 Visit our website: https://hyperbot.network/
🔹 Whitepaper: https://hyperbot.gitbook.io/hyperbots-organization
🔹 Telegram Channel: https://t.me/Hyperbotofficial
🔹 Join Discord: https://discord.com/invite/5AMtqkzpFs
🔹Telegram Tracker Bot :https://t.me/hyperbottracker_bot
🔹Telegram Trading Bot:https://t.me/Hyperbotai_bot
Disclaimer: This report is for informational purposes only and does not constitute financial advice. On-chain data is highly dynamic; high-leverage trading carries extreme liquidation risks.